Website Traffic Statistics in 2026: What the Numbers Tell You (And What to Do About Them)
Explore the latest website traffic statistics for 2026, covering global traffic trends, AI's impact, and industry benchmarks to help you grow smarter.

Frank Zhu
Frank is the founder of Readdy.ai. A developer-turned-founder with 10+ years of product experience, Frank loves great design, and he's building the tools he wishes he had when launching his first startup.
Every business owner wants more website visitors. But before you can attract them, you need to understand how traffic works today, where it comes from, how users behave, and what's quietly changing under the hood. This piece pulls together the most current website traffic statistics to give you a clear picture of the digital landscape in 2026.
Quick Facts: The Most Important Website Traffic Stats Right Now
- Google.com has the highest website traffic globally, with roughly 105 billion average monthly visits. YouTube comes in second, with 3.06 billion average monthly visits, followed by Facebook at 1.67 billion monthly visits. (DemandSage)
- More than half the planet is now online – approximately 5.65 billion people use the internet today. (DemandSage)
- Mobile devices account for 63.05% of all web traffic globally. (DemandSage)
- Organic search generates 53% of total website traffic, making it the single largest source by far. (DemandSage)
- 60% of all Google searches now end without any click to a website. (The Digital Bloom)
- The average bounce rate across all industries was around 45% in 2025. (Calconic)
- The total count of active websites crossed 201 million in the first quarter of 2026, up from 193 million in 2025. (SQ Magazine)
- Pew Research tracked 68,000 real searches and found users clicked a result only 8% of the time when an AI summary appeared, compared to 15% without one. (Demand Local)
- A new website goes live somewhere in the world every second, adding up to roughly 252,000 new sites per day. (SQ Magazine)
Global Traffic Landscapes: Website Statistics by Region
The web's growth is no longer centered in North America or Western Europe. Here is where things stand globally:
- 74% of the world's population, about 6 billion people, were online in 2025, up from 60% in 2020. (ITU)
- Northern Europe leads all regions in internet adoption at 97.7%, followed by Western Europe at 95.1% and North America at 93.3%. (SOAX)
- China has the largest number of internet users at 1.11 billion, followed by India at 806 million and the United States at 322 million. (SOAX)
- Countries like Denmark, the Netherlands, Norway, Saudi Arabia, Switzerland, and the UAE have all reached or are close to 99% internet adoption, near-universal connectivity. (SOAX)
- Despite this growth, 2.2 billion people, one in four globally, still have no internet access, most of them in Southern Asia and sub-Saharan Africa. (HomeFi)
Most new internet users are coming from Asia and the Middle East, and the way those users browse is shaped heavily by the devices and infrastructure available to them. Any website traffic strategy that treats the global audience as a single uniform block is already working with an incomplete map.
Website Traffic Statistics on Device & Platform
Mobile vs. Desktop
The majority of the world’s website traffic comes from mobile phones now.
- Mobile devices held 64.35% of global web traffic as of July 2025, up from 60.61% in Q1 2024, a gain of nearly four percentage points in 18 months. (Quantumrun)
- Desktops, meanwhile, have declined from 42.31% in 2021 to just 35.71% by mid-2025, with tablets now sitting at a tiny 1.84% share. (Quantumrun)
- Africa leads the world in mobile web access, with 79.12% of its web traffic coming from mobile devices in 2025. (Quantumrun)
- 72.3% of all web traffic in Asia comes from smartphones. (TekRevol)
- Germany has roughly 42% mobile web traffic, and the US has approximately 54%. (Quantumrun)
Africa leads the world in mobile web access, reflecting economies where smartphone ownership preceded access to fixed broadband by years. Mobile web traffic in Asia is driven mostly by India and Indonesia, where affordable mobile data has made smartphones the primary internet device
North America and Western Europe are not so mobile-focused because workplace desktop computing remains strong in these regions. Still, even in these regions, the mobile web brings in more new users because of its SEO visibility and accessibility without requiring app installation.
Browser Market Share
Google Chrome holds 66.75% of the mobile browser market as of March 2025, with Apple Safari in second place at 23%. Chrome dominates with the lion's share on desktop as well, while Safari and Edge trail far behind.
In 2025, an estimated 31% of mobile web sessions happen via in-app browsers rather than Chrome or Safari, meaning a significant portion of website visitor statistics you see in your analytics may be coming from people browsing inside apps like Instagram or TikTok rather than standalone browsers. (Quantumrun)
Website Traffic Statistics on Source & Channel Mix
Organic vs. Paid Traffic
- Organic search drives 53% of total website traffic,
- direct traffic accounts for 25%,
- referral traffic represents 13%,
- social media drives 4%, and
- paid search accounts for just 5%. (DemandSage)
However, AI Overviews are compressing the reach of organic search. Google's AI Overviews now appear for 15 to 20% of all queries, more than doubling from 6.49% in January 2025. And when they do appear, the click-through impact is brutal: position-1 CTR drops roughly 34.5% when an AI Overview appears above it. (Demand Local)
Social Referral Traffic
Social media's contribution to web traffic has shifted in character and scale. Facebook still provides 71.58% of social referral traffic, but the discovery behavior that once happened on Facebook and Twitter has largely migrated to TikTok and Instagram. Users now discover brands through short-form video and often search for them directly.
The Rise of AI Referrals
- ChatGPT referral traffic to websites grew from 265,947 sessions in May 2025 to 294,497 in June 2025, a 10.7% increase in a single month. (Siege Media)
- AI search visitors convert 23x better than traditional organic traffic. (Onely)
- AI search platforms generated 12.1% of signups despite accounting for only 0.5% of overall traffic. (Onely)
In other words, the traffic is tiny, but the intent is very high. Sites that earn citations from ChatGPT and Perplexity are getting visitors who are already close to making a decision.

User Engagement & Behavior Metrics
Understanding average website traffic statistics is only useful if you pair them with engagement data. Traffic volume tells you how many people arrived, and engagement tells you what they did next.
Average Bounce Rates by Industry
In 2026, bounce rates by industries range as follows:
- 20%–45% for e-commerce,
- 35%–55% for SaaS,
- 30%–55% for B2B,
- 35%–60% for B2C,
- 15%–60% for service business,
- 70%–90% for blogs, and
- 60%–85% for media and news sites. (Causal Funnel)
These ranges exist because "bouncing" means something different depending on the site. A reader who visits a blog, finds exactly the answer they needed, and leaves has technically "bounced", but the page did its job.
The median bounce rate across all industries is 44.04%. The footwear and apparel industry records the lowest bounce rate at 35.76%, while travel sites have historically recorded some of the highest. (Databox)
Why Shorter Sessions Aren't Always a Red Flag
The average session across the top 100 websites is 11 minutes and 12 seconds, but on most mid-tier sites, sessions are much shorter. This is partly because of how people use search in 2026; many arrive with a specific question, find their answer, and move on.
What hasn't changed is the impact of design and speed. Research shows users make an evaluation of a website's design within 50 milliseconds, and for 94% of users, that initial impression hinges on design elements. Mobile-friendly sites see 24% higher conversion rates than those that aren't optimized. (SQ Magazine)
This is exactly the problem that tools like Readdy are built to solve. As an AI website builder, Readdy generates pages with performance-focused layouts out of the box, mobile versions are included by default, and the AI proactively suggests improvements to structure, content, and SEO. For business owners who don't want to manually debug Core Web Vitals or hire a developer to optimize their layout, this makes things easier. You can build website with AI and get something designed to capture intent immediately, rather than learning by trial and error what slows visitors down.
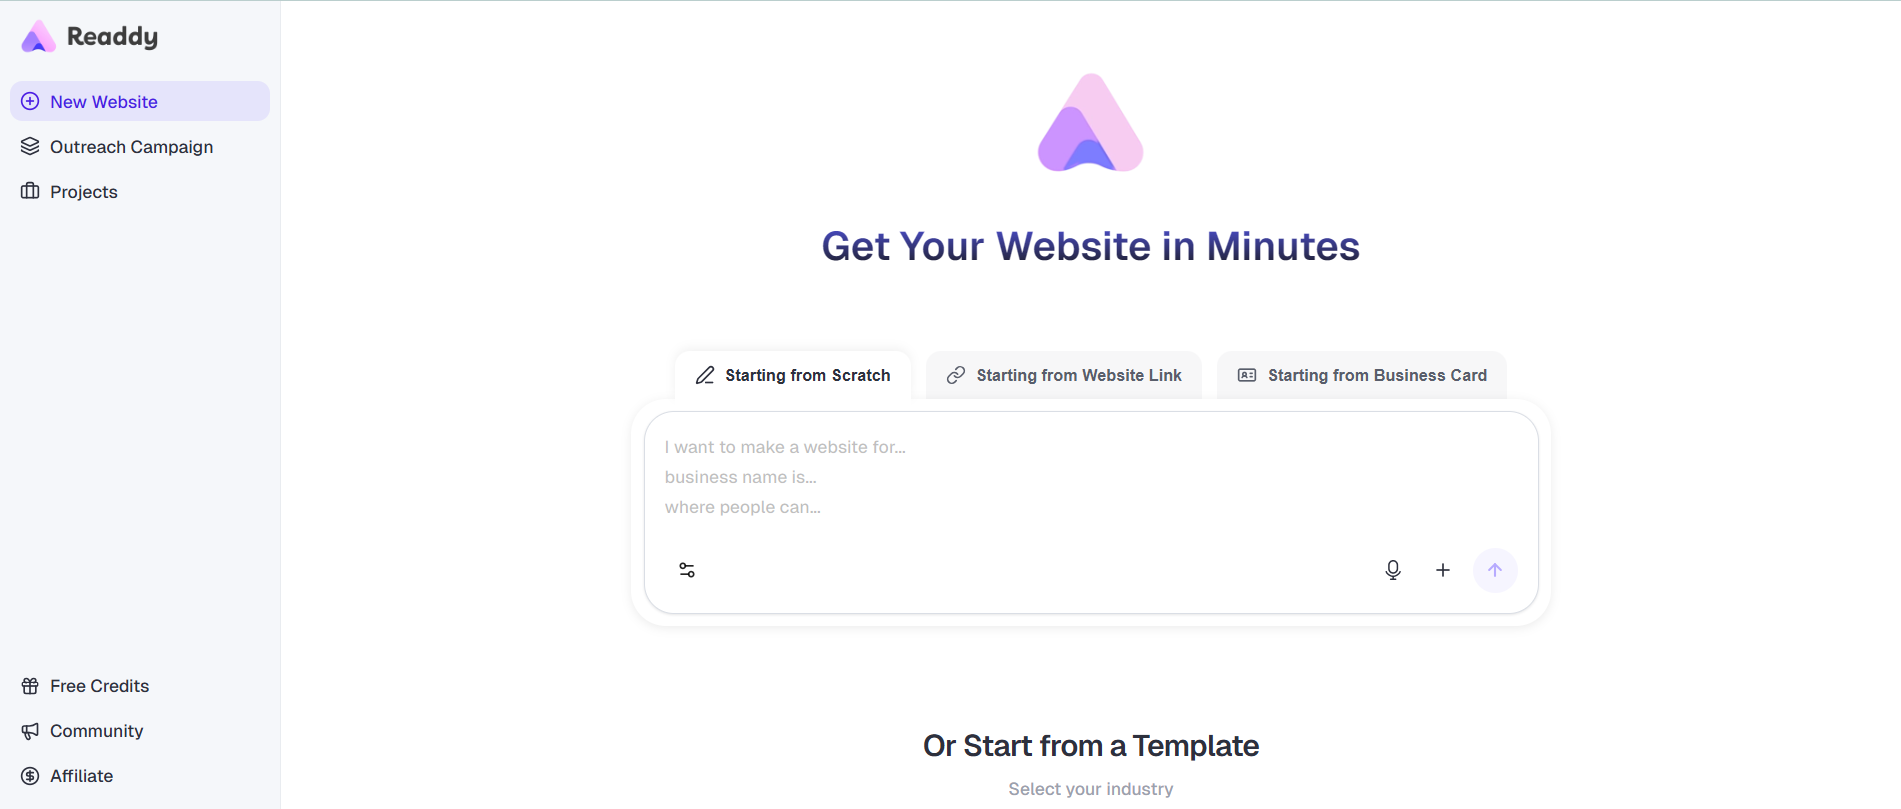
For anyone without a technical background, a no-code AI website builder like Readdy removes the usual bottlenecks between "I have a business" and "I have a working, optimized website."
The AI Shift: Threat and Opportunity
Many people think AI is killing organic traffic, but the reality is more nuanced and actionable.
The median publisher experienced a 10% year-over-year traffic decline in the first six months of 2025, with news publishers down 7% and non-news content sites down 14%. (The Digital Bloom) HubSpot lost between 70%–80% of its organic traffic between November 2024 and Q2 2025, with CEO Yamini Rangan publicly attributing the shift to AI Overviews giving direct answers and reducing the need for users to click through. (Demand Local)
But the same shift that's hurting high-volume informational sites is creating a new referral channel. ChatGPT saw a 44% traffic boost in November 2024, and about 40% to 70% of LLM users now use these platforms to do things like conducting research, summarizing information, understanding the news, and requesting shopping recommendations. (Bain & Company) That's a Discovery Channel that didn't exist three years ago.
The website traffic metrics that matter most in this environment are changing. Ranking position matters less when an AI Overview absorbs the click before the user ever reaches your result. What matters now is whether your site is structured in a way that gets cited by those AI systems, with clear formatting, structured data, and authoritative content that answers questions directly.
This is also where GEO (Generative Engine Optimization) becomes relevant for every site owner. Tools that can build a website from text with AI and include built-in SEO and GEO features, like Readdy's one-click publishing to Google Search Console, take a step toward making that kind of optimization accessible to small business owners who don't have an SEO team.
Addressing Website Traffic Decline and Fluctuation
There are three main reasons sites experience decline in 2026:
Algorithm Volatility
After starting 2025 at appearing for 6.49% of queries, Google's AI Overviews rose to nearly 25% in July before settling back to around 15.69% in November. (Semrush) Each shift like this redistributes traffic across the web. Sites that relied on informational keywords to pull in top-of-funnel visitors have taken some of the hardest hits.
Technical Decay
A site that was fast in 2022 may now be slow because page weight has grown, third-party scripts have multiplied, or the hosting infrastructure hasn't kept pace with growth. If your site was built on older tools without performance optimization baked in, you need to fix that.
The Privacy Shift
With cookie-based attribution eroding, businesses are working with incomplete pictures of their own website visitor statistics. This makes building owned channels, email lists, communities, and direct relationships more valuable than ever, because those don't depend on third-party tracking to function.
Industry-Specific Benchmarks for Website Traffic
E-commerce
E-commerce sites benefit from high-intent traffic but face fierce competition for every click. E-commerce sites are converting around 2% to 4% of visits into sales in 2025, with bounce rates typically landing between 20% and 45% for retail sites with well-optimized product pages and checkout flows. (ListMint) The rise of mobile commerce is a tailwind here. Global mobile e-commerce sales reached $2.07 trillion in 2024 and are projected to hit $3.35 trillion by 2028.
SaaS and B2B
SaaS and B2B sites are dealing with a different set of pressures. 73% of B2B websites experienced significant traffic loss between 2024 and 2025, largely because informational keywords, the ones that once drove top-of-funnel discovery, are now answered by AI Overviews before users ever visit a site. (KEO Marketing) Bounce rates for SaaS sites tend to run between 30% and 55%, though this varies significantly by traffic source.
News and media
News and media sites have taken the biggest blow. News publishers’ organic visits dropped from 2.3 billion to under 1.7 billion monthly, roughly 26%, between mid-2024 and May 2025. (Superprompt) The AI Overview growth rate in news-adjacent categories like restaurants (273%) and real estate (258%) between January and March 2025 has been particularly sharp.
Website Traffic Statistics FAQs
How do I see my website traffic?
The most common tools are Google Analytics 4, which is free, and Google Search Console, which shows you search-specific performance data, including impressions and click-through rates. Paid tools like Semrush, Ahrefs, and Similarweb can show you competitor traffic estimates alongside your own.
Why do my website traffic reports differ?
Each analytics tool uses a different methodology. Google Analytics tracks actual sessions via a JavaScript tag. Third-party tools like Similarweb and SimilarWeb use panel data and modeling to estimate traffic. The numbers will never perfectly align, and the gap tends to be larger for smaller sites.
How much traffic should come from AI search engines vs. Google?
Right now, AI referral traffic is still a small fraction for most sites. By July 2025, organic search traffic was over 460 times larger than ChatGPT referral traffic in absolute terms. But growth is fast, and the conversion quality is disproportionately high.
Does mobile traffic convert as well as desktop traffic?
Generally, no, but the gap is narrowing. Desktop still converts better for most industries, particularly B2B and considered purchases. Mobile bounce rates reach 58% to 60% on average, compared to 48% to 50% for desktop. That said, mobile web still drives over 35% of e-commerce conversions, so ignoring mobile optimization means leaving real revenue on the table.
Can an AI website builder really improve my traffic stats?
It depends on the builder. Some AI website builders for beginners generate sites quickly, but without the performance optimization needed to rank and retain visitors. A production-ready website generator like Readdy builds complete sites with backend, authentication, database, and SEO configuration included, rather than producing a static page that needs separate infrastructure. The built-in GEO and SEO features, combined with mobile-first layouts, address the technical factors that determine whether a site performs. You can also convert a website link into an editable project if you want to rebuild an existing site with better performance. For those starting from scratch, you can build a website from a screenshot or use the AI website generator to describe what you need in plain language and get a deployable result.
What is a "good" bounce rate for websites?
There's no single answer. 26% to 40% is the range websites should aim for; if your analytics shows this range, you're outperforming most competitors. 41% to 55% is average for most websites, and 70% or above is a cause for alarm, except for blogs and news sites, where high single-page sessions are expected. (Claspo) The most useful comparison is always against your own industry benchmark, not a general average.
Wrapping Up
Web traffic in 2026 is more fragmented than it's ever been. Organic search still dominates as a channel, but its reliability is declining as AI systems answer more queries before users ever click. Mobile has overtaken desktop in every meaningful measure. And new traffic sources, especially AI referrals from tools like ChatGPT and Perplexity, are low-volume but high-quality in conversion.
For business owners who want to skip the complexity and get straight to a site that performs, the best AI website builder, like Readdy, bridges that gap, giving you a complete, deployable, AI-powered website builder solution without needing a development team.
Frank Zhu
Frank is the founder of Readdy.ai. A developer-turned-founder with 10+ years of product experience, Frank loves great design, and he's building the tools he wishes he had when launching his first startup.